
 Hedging
 Liquidity Solutions
 Cash Flow Forecasting
 Corporate Treasury Outsourcing
 Treasury Technology
 Connectivity
 Supply Chain Finance
 SME Forex
 Money Market Funds
The Braai Index — Why the Boerewors Beats the Bureaucracy
The Power Paradox — When Load-Shedding Fades, Growth Flickers Back
The Fuel Factor — The Invisible Tax on Everything
Candlelight Consumption — The Psychology of the “Crisis Economy”
The “Braai-to-Blackout Index” — South Africa’s Real Economy in One Table
Introduction
If South Africans designed their own inflation gauge, it wouldn’t start with the Consumer Price Index (CPI). It would begin with a bag of charcoal, a litre of petrol, and a load-shedding schedule.
Because in a country where the braai is both a cultural cornerstone and a coping mechanism, the real measure of the economy isn’t the repo rate — it’s how much it costs to keep the fire going.
The Braai Index — Why the Boerewors Beats the Bureaucracy
Economists track headline inflation. Ordinary South Africans track how much it costs to host a Sunday braai. The difference between the two is the gap between statistical inflation and felt inflation — and in 2025, that gap is widening again.
According to Statistics South Africa (Stats SA), headline CPI eased to 3.3% year-on-year in August 2025, down from 3.5% in July. That’s comfortably within the Reserve Bank’s 3–6% target band — technically “price stability.”
But beneath that calm surface, the essentials are running hot:
- Food and non-alcoholic beverages inflation: 5.2% year-on-year.
- Meat prices: rising faster than any other category, with beef cuts up 10–12% according to retail trackers.
- Charcoal and firelighters: up nearly 9% year-on-year (Stats SA household utilities sub-index).
- Beer and beverages: up around 7%.
So, while the official inflation print looks tame, the cost of hosting a weekend braai — that social glue of South African life — is climbing at nearly twice the pace of CPI.
Chart 1: The “Braai Index” vs Official Inflation (Sep 2024 – Aug 2025)
(Composite estimate combining Stats SA food and energy data)
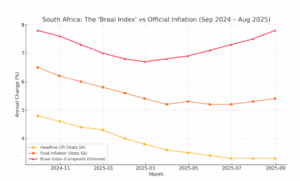
The “Braai Index” captures what households feel: that their personal inflation rate — the cost of food, drinks, energy, and transport — sits somewhere between 6% and 8%, not the polite 3.3% announced in Pretoria.
To the average household, inflation isn’t an index — it’s a trolley.
The Power Paradox — When Load-Shedding Fades, Growth Flickers Back
For once, South Africa’s economic good news starts with Eskom. In 2025, load-shedding has virtually disappeared — and the knock-on effects are significant.
- Between 1 April and 31 August 2025, Eskom reported just 26 hours of total load-shedding, versus over 3 000 hours in 2023.
- The utility’s Winter 2025 System Outlook projects no further load-shedding if unplanned outages remain under 13 000 MW.
- The OECD estimates that the electricity drag on GDP has fallen to just 0.2 percentage points, from well over 1% two years earlier.
- Energy Availability Factor (EAF) climbed back above 70% for the first sustained period since 2018.
The results go beyond macroeconomic models:
- Businesses are saving on diesel and productivity losses.
- Retailers and factories are operating full hours.
- Households are spending less on inverters and candles.
A 2025 CSIR analysis found that load-shedding previously cost the economy over R1 billion a day. Its near elimination has quietly added at least 0.5–1% to potential GDP growth.
Chart 2: Load-Shedding Hours per Year (2023 – 2025)
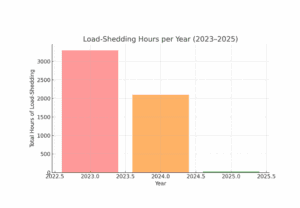
The data is transformative: a shift from survival-mode energy management to potential reindustrialisation. And in a country that’s had more blackouts than growth spurts, this reversal carries enormous symbolic weight.
The Fuel Factor — The Invisible Tax on Everything
If load-shedding relief is the year’s good news, fuel prices remain the economy’s persistent headwind.
- Inland 95 ULP petrol stood at R21.63/litre in October 2025 (DMRE).
- Diesel remains around R20.92/litre, with a modest 5% annual rise.
- Transport represents ~16% of household expenditure in the CPI basket, and much more for low-income workers commuting long distances.
The trouble is the second-round effect: higher transport and logistics costs push food prices higher. Every litre of diesel burned by trucks delivering produce adds cents to the cost of bread, vegetables, and, yes, boerewors.
For South African households, this creates a “fuel pass-through” cycle — the petrol station dictates what the supermarket shelf looks like.
Chart 3: South African Petrol Price Trend (2025)
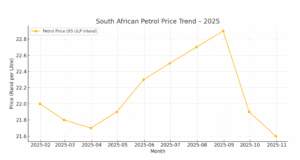
Even though the rand has stabilised and global oil prices softened, local pump prices remain sticky, underpinned by taxes, levies, and refining constraints.
In short: the petrol price is less volatile, but not forgiving.
Candlelight Consumption — The Psychology of the “Crisis Economy”
Despite financial strain, South Africans continue to spend on small comforts: takeaways, cappuccinos, a few beers for the braai. This is behavioural economics in action — a textbook case of the “lipstick effect.”
According to the Old Mutual Savings & Investment Monitor (2025):
- 76% of South Africans say they are financially stressed.
- 62% have cut back on major purchases.
- Yet 48% report spending on “affordable luxuries” to maintain normalcy.
This isn’t irrational. It’s a coping mechanism. When big-ticket items like cars or holidays feel impossible, people cling to smaller rituals — a braai, a takeaway, a drink — to retain dignity and joy.
The “Braai-to-Blackout Index” — South Africa’s Real Economy in One Table
|
Component |
2025 Trend |
Economic Impact |
|
Food & Braai Costs |
↑ 5–10% y/y (Food inflation 5.2%) |
Real inflation feels higher than CPI |
|
Power Supply |
↓ Massive improvement (26 hours YTD) |
Boosts productivity, reduces costs |
|
Fuel & Transport |
High but stabilised (~R21.6/l) |
Sustains cost pressure on logistics & food |
|
Consumer Behaviour |
Resilient small-spend habits |
Maintains retail, hospitality activity |
This composite picture tells the story of a country that is still paying more to live — but at least no longer paying for darkness.
The Takeaway — Reading the Economy From the Braai Fire
South Africa doesn’t need to invent a new index — it already lives one. It’s there in the price of meat, the glow of charcoal, the stability of the power grid, and the fuel slip in your cubbyhole.
If you really want to know how the economy’s doing, forget the CPI printout. Ask your neighbour:
“How much did your last braai cost?”
“How many hours were you without power this week?”
“How much did you spend on fuel this month?”
Those answers say more about South Africa’s resilience — and its hope — than any spreadsheet.