
 Hedging
 Liquidity Solutions
 Corporate Treasury Outsourcing
 Connectivity
 Supply Chain Finance
 SME Forex
Intro
Treasury KPIs only add value when they help you make decisions earlier and with more confidence. The best KPI packs do three things well:
• Protect liquidity and cash generation
• Reduce financial risk and volatility
• Improve control, efficiency and governance in treasury operations
This paper starts with the KPIs that matter most across Cashflow, Risk Management, and Treasury Administration, then unpacks what each one means, how it should be measured, and what “good” typically looks like in practice.
1) The KPIs that matter most
 Cashflow KPIs (liquidity, cash performance, working capital)
These KPIs indicate whether the business can fund operations and growth without stress and how efficiently cash is generated.
- Liquidity Headroom (Cash + committed facilities vs forecast needs)
- Cash Flow Forecast Accuracy (7/30/90 days)
- Cash Flow from Operations (CFO / Operating Cash Flow)
- Free Cash Flow (FCF)
- Cash Conversion Cycle (CCC)
- Days Sales Outstanding (DSO)
- Days Payable Outstanding (DPO)
- Cash Flow Margin
 Risk management KPIs (FX, interest rate, liquidity, counterparty and controls)
These KPIs show whether treasury contains volatility, stays within policy, and protects cash and earnings.
- FX Exposure Coverage Ratio
- Hedge Effectiveness (FX and/or interest rate hedges)
- Interest Rate Sensitivity (1% shock impact)
- Fixed vs Floating Debt Mix vs Policy
- Counterparty Concentration (top 3 banks)
- Limit Utilisation and Breaches (count and severity)
- Stress Survival Horizon (liquidity stress test coverage)
 Treasury administration KPIs (control, efficiency, compliance)
These KPIs demonstrate that treasury is well-run, audit-ready, and not relying on heroic measures.
- Daily Cash Position Accuracy
- On-time Bank Reconciliations (within SLA)
- Payment Processing Accuracy (error/recall/rework rate)
- Straight-Through Processing Rate (STP%)
- Treasury Policy Exception Rate (and time-to-close)
- Bank Fees and Cost-to-Serve (trend vs budget/benchmark)
- Confirmation/Documentation Timeliness (deals, mandates, KYC)
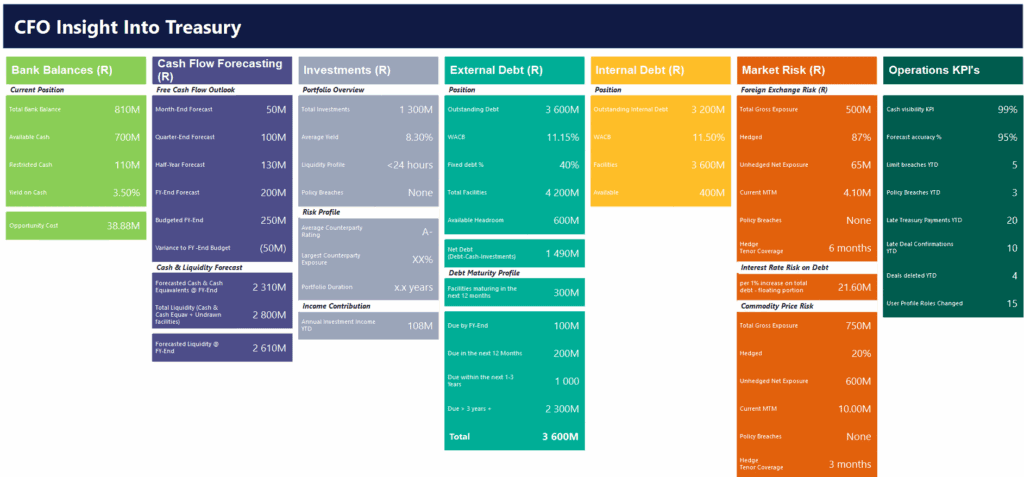
2) Explaining the KPIs: what they mean and how to use them
Cashflow KPIs
1) Liquidity Headroom
What it is: your near-term ability to meet obligations without scrambling for funding.
How to measure (practical): Liquidity Headroom = (Cash + Available committed undrawn facilities) – Stressed net outflows over the horizon
How to use it: This is your number one early-warning KPI. Track it daily or weekly, and set a minimum threshold.
2) Cash Flow Forecast Accuracy (7/30/90 days)
What it is: how reliable your forecast is over different horizons.
How to measure: compare forecast to actual by bucket (timing vs value vs missing items).
How to use it: If accuracy drops, liquidity KPIs become less reliable. Treat this as a control KPI, not a “nice to have.”
3) Cash Flow from Operations (CFO / Operating Cash Flow)
What it is: cash generated from core business activity.
How to measure: as per your financial reporting definition, consistently applied.
How to use it: Falling CFO is often the earliest sign that margin pressure, collections, or inventory build is hitting liquidity.
4) Free Cash Flow (FCF)
What it is: cash available after capex needed to maintain or grow operations.
How to measure: FCF = CFO – Capex
How to use it: FCF funds debt reduction, dividends, acquisitions and growth. Negative FCF isn’t always bad, but it must be planned and funded.
5) Cash Conversion Cycle (CCC)
What it is: how long cash is tied up in the operating cycle.
How to measure: CCC = DIO + DSO – DPO
How to use it: Use CCC to connect working capital behaviour to liquidity. If CCC increases, treasury should quantify how much additional cash is tied up.
6) Days Sales Outstanding (DSO)
What it is: how quickly the business collects cash from customers.
How to measure: standard DSO calculation used by Finance (consistency matters more than perfection).
How to use it: Rising DSO is usually a cash warning sign before it becomes a P&L issue.
7) Days Payable Outstanding (DPO)
What it is: how long the business takes to pay suppliers.
How to measure: consistent DPO definition aligned to AP and procurement.
How to use it: DPO drops often signal leakage in payment discipline or a shift in supplier power.
8) Cash Flow Margin
What it is: how efficiently revenue converts into operating cash.
How to measure: Cash Flow Margin = CFO / Revenue
How to use it: This is one of the cleanest “quality of earnings” indicators from a cash perspective.
Risk management KPIs
1) FX Exposure Coverage Ratio
What it is: % of known/forecast FX exposures that are identified and managed (hedged, naturally offset, or accepted within risk appetite).
How to measure: Covered exposure / total exposure by horizon (e.g., 0–30 days, 31–90 days).
How to use it: This is the discipline KPI for FX. If coverage drops, volatility risk rises.
2) Hedge Effectiveness
What it is: whether hedging is actually reducing volatility.
How to measure (practical): compare outcomes vs an unhedged position, or track variance reduction in cashflows/P&L.
How to use it: If effectiveness is low, the issue is typically hedge structure, timing, or exposure quality.
3) Interest Rate Sensitivity (1% shock impact)
What it is: the impact on interest cost (or earnings) if rates move 1%.
How to measure: apply a 1% shift to floating exposures net of hedges.
How to use it: This is a board-friendly risk metric. It clarifies whether you’re positioned for “higher for longer” or cuts.
4) Fixed vs Floating Debt Mix vs Policy
What it is: alignment to your risk appetite on interest rate exposure.
How to measure: % fixed vs floating, including swaps/caps.
How to use it: If you drift out of policy, you either rebalance or formally accept the deviation.
5) Counterparty Concentration (top 3)
What it is: how exposed you are to a small set of banks.
How to measure: % of cash, investments, and derivatives exposure with top 3 counterparties.
How to use it: Concentration above policy is a structural risk that should trigger diversification.
6) Limit Utilisation and Breaches
What it is: whether treasury is operating within approved limits.
How to measure: % utilisation vs limits, plus number of breaches/exceptions, and time-to-close.
How to use it: This is a governance KPI. Breaches should be rare and explained.
7) Stress Survival Horison
What it is: how long the organisation can fund itself under defined stress assumptions.
How to measure: days/weeks of coverage under stress scenarios (collections slow, FX move, delayed funding).
How to use it: It turns “we’re fine” into a measurable statement and supports proactive funding actions.
Treasury administration KPIs
1) Daily Cash Position Accuracy
What it is: how reliable the daily cash position is.
How to measure: variance between the reported cash position and the validated bank position.
How to use it: If this KPI isn’t strong, everything built on top of it is at risk.
2) On-time Bank Reconciliations (within SLA)
What it is: whether cash and transactions are reconciled on time.
How to measure: % accounts reconciled within SLA and aging of exceptions.
How to use it: This is a control and audit KPI. Backlogs increase risk quickly.
3) Payment Processing Accuracy (error/recall/rework rate)
What it is: operational quality of payments.
How to measure: failed/returned payments, recalls, amendments as % of volumes.
How to use it: It is one of the clearest indicators of operational risk.
4) Straight-Through Processing Rate (STP%)
What it is: how many workflows are without manual handling?
How to measure: % payments/trades processed without manual intervention.
How to use it: Low STP increases cost and operational risk; improving it is a scalable efficiency lever.
5) Treasury Policy Exception Rate (and time-to-close)
What it is: how often treasury operates outside defined policy and how quickly exceptions are closed.
How to measure: # exceptions per month; average days to close.
How to use it: This is governance made measurable.
6) Bank Fees and Cost-to-Serve
What it is: what the banking structure costs and whether it is improving.
How to measure: total bank fees by bank/entity, trend vs budget and activity drivers.
How to use it: Links treasury operations directly to measurable cost outcomes.
7) Confirmation and Documentation Timeliness
What it is: how quickly deals are confirmed and critical documentation stays current (mandates, KYC).
How to measure: % confirmations matched within SLA; % KYC/mandates current; items nearing expiry.
How to use it: Keeps treasury audit-ready and reduces avoidable operational exposure.
3) Why IT2 changes the KPI conversation
Most KPI packs fail for the same reason: the team spends time compiling and validating data instead of using it to make decisions. Visibility is delayed, definitions vary, and root causes are difficult to identify.
A treasury management system like IT2 changes that by making KPI reporting part of day-to-day treasury operations:
- A single view of cash and liquidity across entities, banks and currencies improves speed and confidence in decisions.
- Dashboards and trend views highlight what changed and where, without rebuilding reports.
- Forecast-to-actual comparisons improve forecasting discipline by isolating timing, amount, missing items and FX impacts.
- Consistent definitions and controls reduce “version of the truth” debates and improve governance.
- Drill-down from KPI to transaction and exposure level turns KPIs into action, not just reporting.
Start with a short assessment

We’ll review your current cash visibility, controls, and exposure reporting, then outline the quickest path to measurable improvement.
Free Assessment